Food Interpreter
GCP, Go, GitHub Actions, Terraform
Github
I've designed a language that can be used as a food diary to help users watch their overall health. The goal of this project is to turn any input of the language, like a food diary and eventually a http request, into a csv that could then be used to visualize and graph a user's food intake. The idea is to show the user the amount of foods they eat, the nutrition, and eventually more. Other than food intake, other goals for the interpreter include food output, sleep, and exercise.
At a glance, some of the technical features I've completed include the following:
- Wrote the Lexer and Parser in the Go programming language.
- Wrote Terraform code to deploy various GCP resources such as:
- Pub/Sub Topics and Subscriptions for asynchronous communication between services.
- Cloud Run Services for serverless computation.
- Artifact Repository to hold Docker images.
- IAMs to run everything on a least privilege principle.
- Created CI/CD pipelines using GitHub Actions to do the following:
- Run the Lexer tests automatically after every commit.
- Run Terraform plan and apply to deploy to Google Cloud Platform.
- Push the Interpreter and Gateway Docker Images.
I designed and implemented a context free grammar without using a complier-compiler, partly for fun and as a challenge. I wanted it to be as simple as possible to make it easy for anyone to use, while still being relatively expressive.
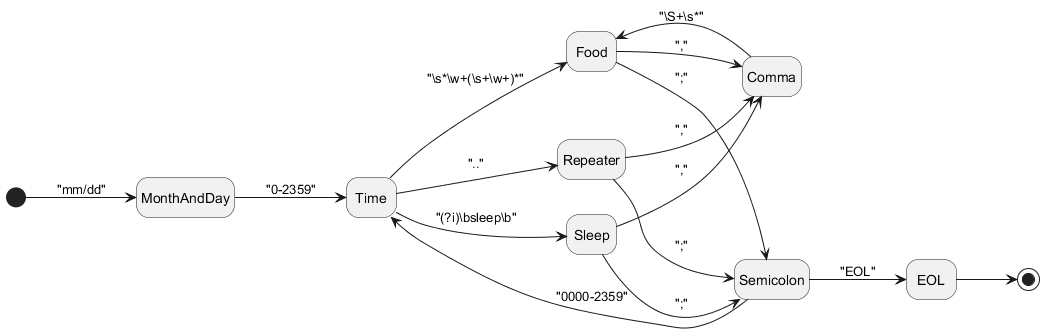
An example diary/sentence in the langauge would be like this:
1/19 700 bacon, eggs, orange juice; 1200 sandwich, apple juice, banana; 1430 chips; 1800 pierogi, meatballs, beef stew;y2025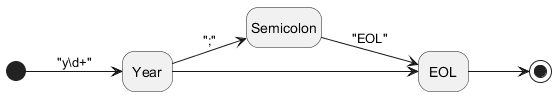
Isolation Game
C++, Qt
Github
Two players start on an 8x8 board, and each player can move spaces like they would a queen in chess. The spaces that each player moves to become occupied, can't be moved to anymore, and become a barrier when left. The goal is to isolate your opponent to the point that they have no more available moves.
I implemented the GUI using C++ and Qt, and my friend did more finishing touches on the AI. I wanted the player to understand it easily from just playing it without having to rely on a tutorial, hints, tips etc. I made the controls click-and-drag and had viable positions for them to move onto have a visual indicator.
Lexical and Syntax Analyzer
Java
Github
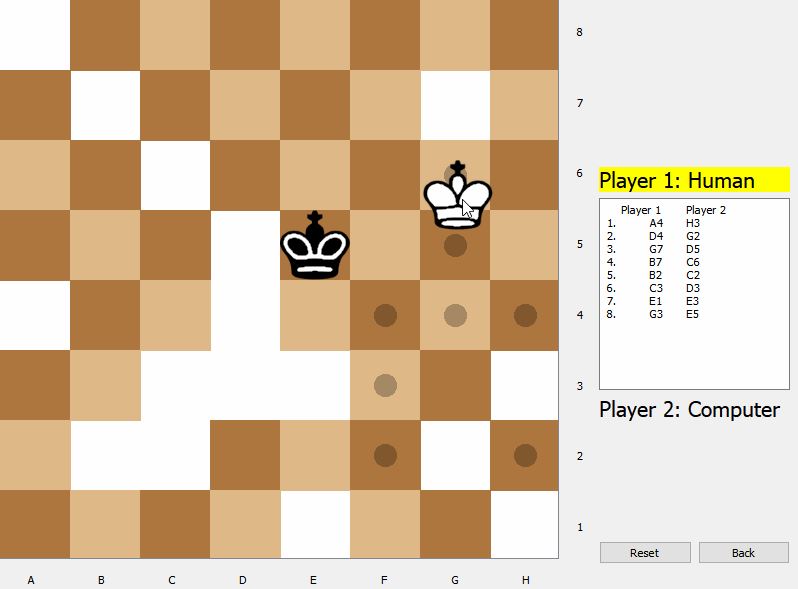
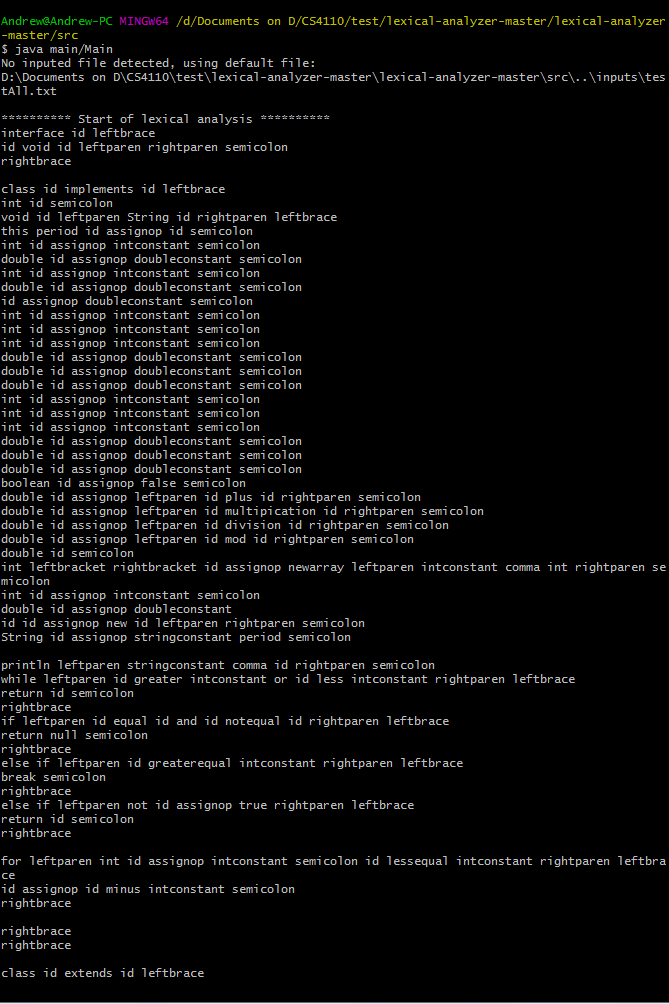
This program reads an input or text file, tokenizes it and checks for proper syntax according to the lexical and syntax conventions of the Toy programming language.
Together with my teammate we worked on this for our Compilers and Interpreters course, probably my most favorite course while attending Cal Poly Pomona. The things we learned in that course I still use directly and indirectly to this day.
On this project, I worked on both the scanner, parser, and trie table. I used both JFlex and CUP to create the scanner and parser respectively. I also resolved grammar conflicts such as shift-reduce and reduce-reduce conflicts by rewriting the grammar so that the conflicts never occurs. I even taught my teammate how to use Git and GitHub so that we could more easily work on the program together.
Below is an example of the syntax analysis.
Below is an example of the lexical analysis.
Purple Air Data Visualizations of Cal poly Pomona
Python, NumPy, Pandas, MatPlotLib
Github
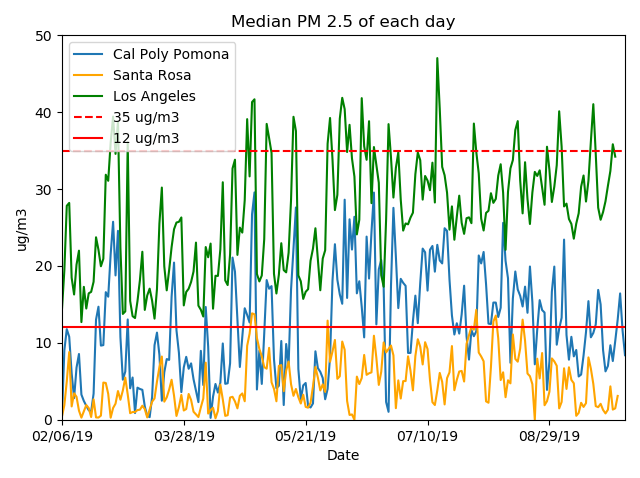
This program was used to make graphs of Particulate Matter (PM) of Cal Poly Pomona and other cities in California as comparisons. Using public Purple Air sensors, I was able to extract it's data containing PM levels, temperature, humidity, etc. and graph them with relation to time.
Below is an example of one of the graphs.
You can view more of the graphs on the readme in the GitHub repository
here.